29/4/2014 The following information is a little bit stale. Since version 5.9.1 of ActiveMQ, Hawt.io is no longer part of the ActiveMQ distribution from Apache, but Jolokia is. Jolokia runs on http://localhost:8161/api/jolokia by default, so if you keep this in mind while reading this post, the remaining instructions are still correct. Dejan Bosanac has written about how to install Hawt.io on ActiveMQ post 5.9.1 if you want to set it up (which of course you do – because it’s awesome.)
—
It’s been a while since I blogged, since my year has been consumed by a not-so-secret-if-you-follow-me-on-twitter project, but I thought I’d take a break to write about something pretty significant in the ActiveMQ landscape. Unusually enough it’s not the addition of a new feature, but rather an enabling technology.
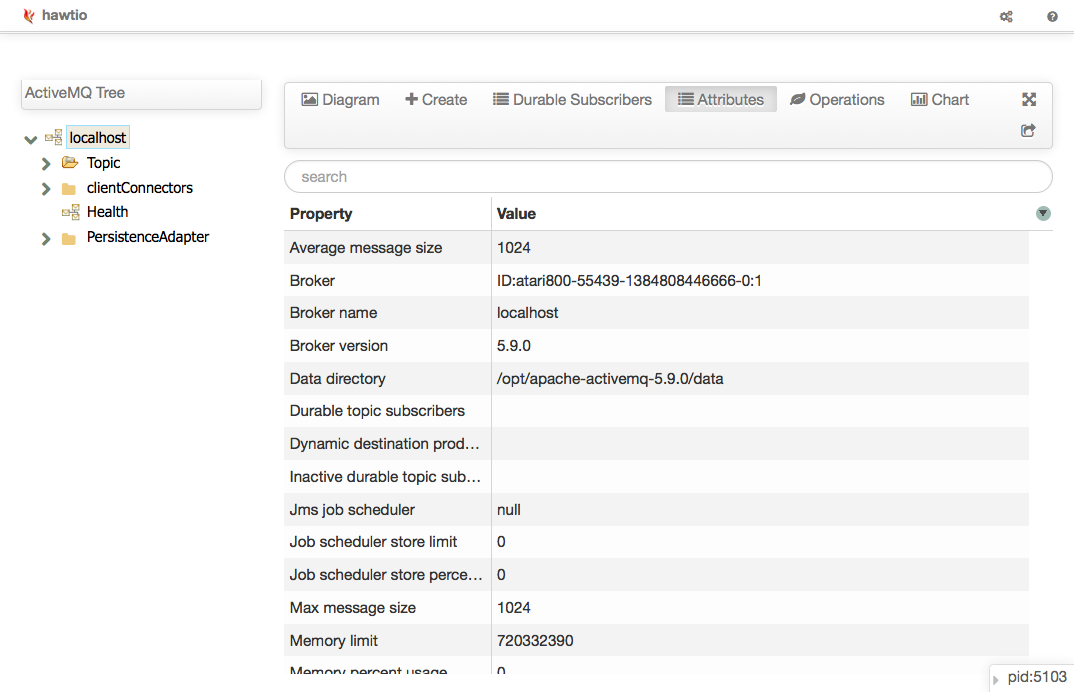
Unless you have been hiding under a rock this year, you will have probably heard about the “One Console to Rule Them All” – Hawt.io. In short it’s a console for building consoles, with built-in plugins for all the shiny things in the Apache integration toolchain that I work with – ActiveMQ, Camel, Karaf etc. as well as a bunch of other stuff including Fabric, JBoss, Tomcat, Infinispan, OpenEJB etc. And you can also build your own plugins. Hawt.io is pretty damn cool – you can deploy it into a Karaf or web container, it automatically detects what tech pieces it knows about, and exposes a super-shiny console.

The killer feature for me, since I use it on site with clients all the time, is that it gets all this info through JMX – in a JavaScript console written in AngularJS running in your browser! Which for me means no installing jvisualvm and opening ports in firewalls to access the JMX port 1099 on the host machine.
As neat as Hawt.io is, it’s what’s inside that’s really exciting. The secret sauce here is the framework that exposes all the JMX stats to the front-end – a tiny tool called Jolokia. Jolokia is a web app that exposes the JMX stats of the JVM that it’s running inside of over HTTP via REST/JSON. It’s also been included in ActiveMQ since version 5.8.
I’ll let this sink in for a bit.
Ready? What this means is that in ActiveMQ 5.9 you can do this:
$ curl -u admin http://localhost:8161/hawtio/jolokia/ && echo ""
In ActiveMQ 5.8 you replace hawtio/jolokia in the above URI with api/jolokia.
Which after prompting you for the default JMX password (admin/admin) gives you this:
{
    "timestamp":1384809685,
    "status":200,
    "request":{
        "type":"version"
    },
    "value":{
        "protocol":"7.0",
        "agent":"1.1.4",
        "info":{
            "product":"jetty",
            "vendor":"Eclipse",
            "version":"7.6.9.v20130131"
        }
    }
}
This means that you can now access any JMX stats exposed by ActiveMQ from any environment that can make a web request – shell scripts, admin GUIs, anything!
You can access specific parts of the JMX tree by passing a JSON request through that acts a a query parameter. For example to aceess the heap memory usage of the JVM you would pass in:
{
    "type":"read",
    "mbean":"java.lang:type=Memory",
    "attribute":"HeapMemoryUsage",
    "path":"used"
}
Here’s the escaped curl request:
$ curl -u admin -d "{\"type\":\"read\",\"mbean\":\"java.lang:type=Memory\",\"attribute\":\"HeapMemoryUsage\",\"path\":\"used\"}" http://localhost:8161/hawtio/jolokia/ && echo ""
And here’s the response:
{
    "timestamp":1384811291,
    "status":200,
    "request":{
        "mbean":"java.lang:type=Memory",
        "path":"used",
        "attribute":"HeapMemoryUsage",
        "type":"read"
    },
    "value":224135568
}
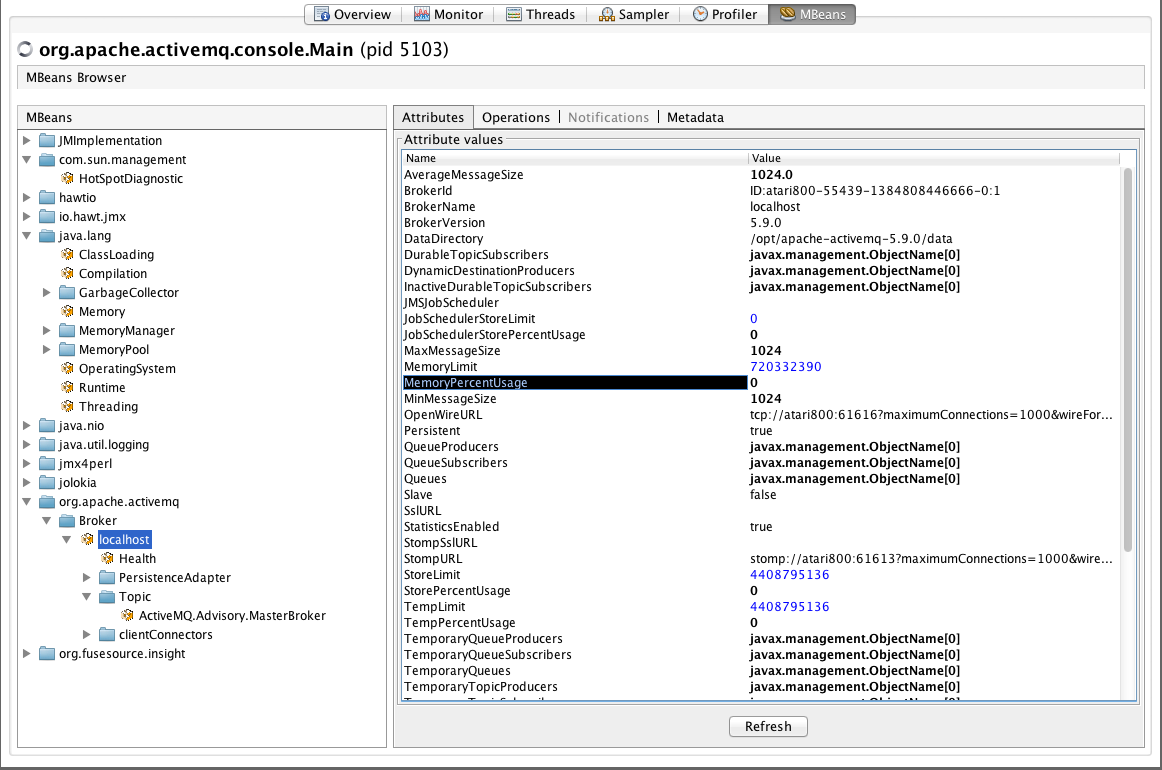
We can also use this to access the really juicy, interesting ActiveMQ stats. Here we’ll grab the broker’s MemoryPercentUsage. You can locate the path you are interested in via jvisualvm/jconsole:
Here’s our formatted JSON payload for the query:
{
    "type":"read",
    "mbean":"org.apache.activemq:type=Broker,brokerName=localhost",
    "attribute":"MemoryPercentUsage"
}
Here’s the escaped curl request:
$ curl -u admin -d "{\"type\":\"read\",\"mbean\":\"org.apache.activemq:type=Broker,brokerName=localhost\",\"attribute\":\"MemoryPercentUsage\"}" http://localhost:8161/hawtio/jolokia/ && echo ""
And here’s the response:
{
    "timestamp":1384811228,
    "status":200,
    "request":{
        "mbean":"org.apache.activemq:brokerName=localhost,type=Broker",
        "attribute":"MemoryPercentUsage",
        "type":"read"
    },
    "value":0
}
Plenty of room for non-persisted queue messages! 😉
It’s yet another tool that adds an already rich set of features for monitoring ActiveMQ that include:
Combine it with Camel, and you could even periodically send SNMP traps. Open source FTW!
Comments
3 responses to “Monitoring ActiveMQ via HTTP”
Concise and relevant article as always Jakub! One suggestion I would have to make this a bit easier would be to put the payload into a file and invoke curl like this:
curl -u admin -d @ … etc etc etc …
Noob question.
Hi. I’m new to the whole monitoring of tomacat and activemq.
I have an instance of tomcat with activemq running on windows.
This was installed and configured by someone else.
What I’m looking for is how to monitor the activemq. I’d like to monitor how many requests activemq has received, how many it has processed. I don’t see the typical activemq-admin I’ve seen some posts referring to. My question is simple: how do I set up JMX and how do I monitor activemq via JMX.
I apologize ahead of time if my question seem unclear. I may not be explaining my question properly.
Any help would be greatly appreciated.
Regards.
Great post which save my life… 🙂
So here is another example which can be interesting for others…
How to add or remove queues
I use the following commands with the JSON request located in a file for easier reading:
curl -u admin:admin -d “@/tmp/createQ_json.txt” http://localhost:8161/hawtio/jolokia/
curl -u admin:admin -d “@/tmp/removeQ_json.txt” http://localhost:8161/hawtio/jolokia/
And here is what I have in my 2 files:
createQ_json.txt
{
“type”:”exec”,
“mbean”:”org.apache.activemq:type=Broker,brokerName=localhost”,
“operation”:”addQueue(java.lang.String)”,
“arguments”:[“q_OMG”]
}
removeQ_json.txt
{
“type”:”exec”,
“mbean”:”org.apache.activemq:type=Broker,brokerName=localhost”,
“operation”:”removeQueue(java.lang.String)”,
“arguments”:[“q_OMG”]
}
Regards,
JM.